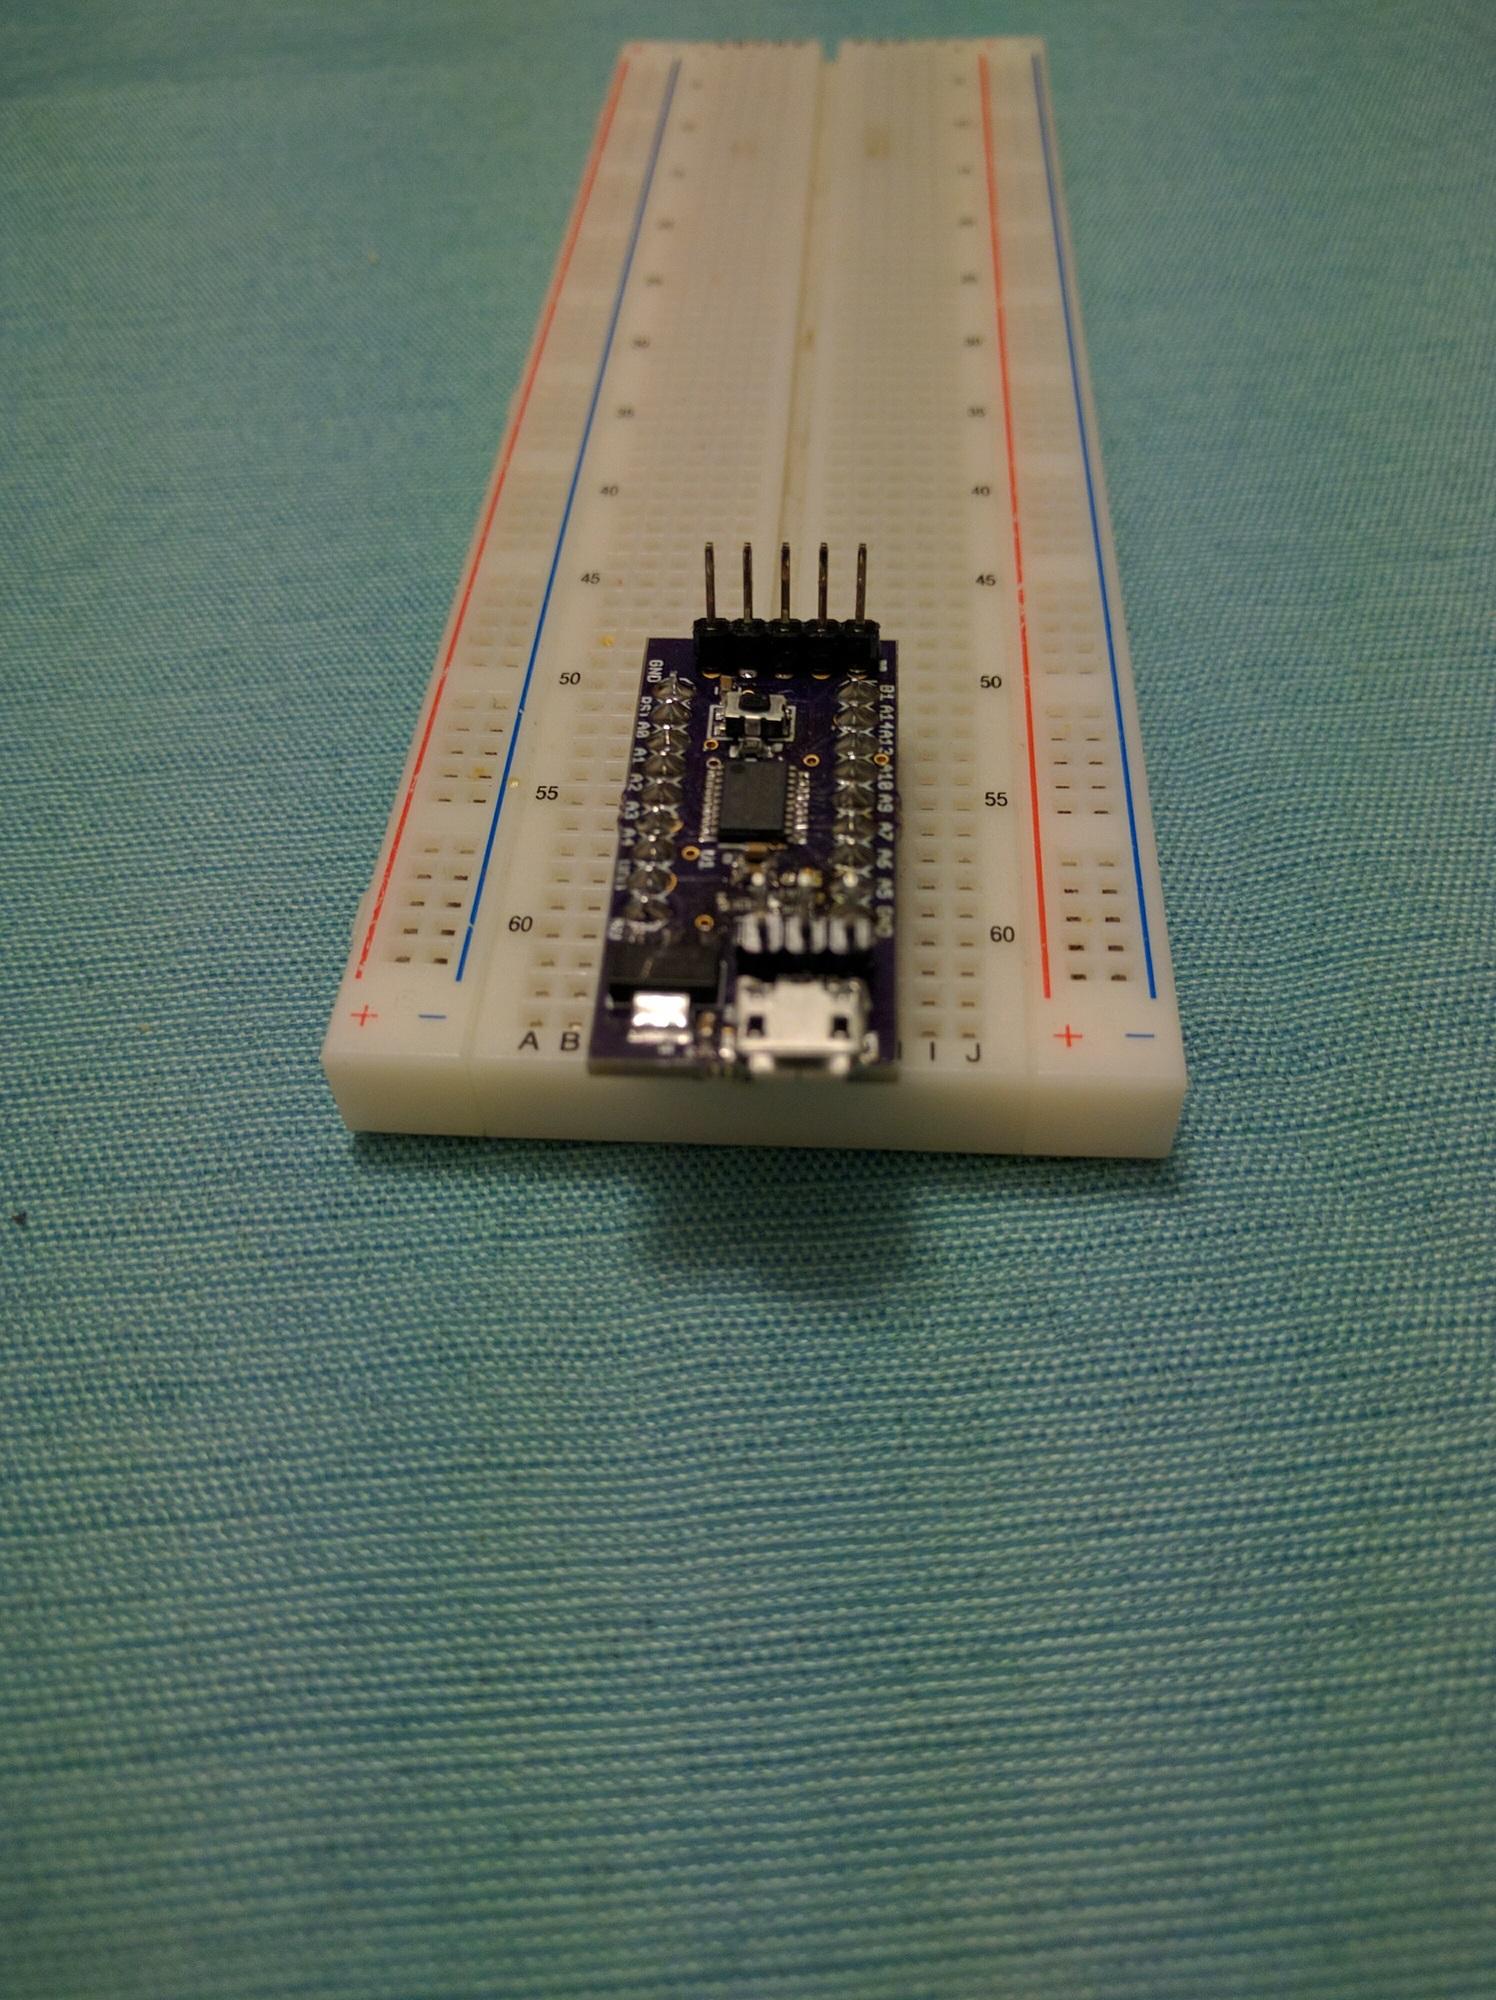
I have details and more pictures here: stm32f030 devboard
I learned through this that 0603 parts are my limit. I’ve never done anything that small before, and they took some time to figure out how to handle them.
I need to wear two pairs of x3 reading glasses just to have a sporting chance of placing them.
The hands are steady enough, but the eyesight is not quite what it was when I was 21
I need to wear two pairs of x3 reading glasses just to have a sporting chance of placing them.
The hands are steady enough, but the eyesight is not quite what it was when I was 21
I also bought some x10 headgear from AliExpress, but its totally useless, as the focal distance is about 2cm, which makes it impractical to get that close to the OCB while wearing the contraption. It came with interchangable lenses going up to x50, but they are even less usable.
I also have a cheap USB microscope, but the lag on the display make it impractical to use for placing components, However its Ok for just doing inspection
A x10 jewellers loop is also very handy to have, especially for looking at markings on devices, and for doing inspections e.g. looking for solder bridges etc
http://www.ebay.co.uk/itm/15X-Head-Band … Sw~gRV0y~8
…very cheap, and fairly good, so long as you avoid poking your eye out while trying to figure out how to wear it.
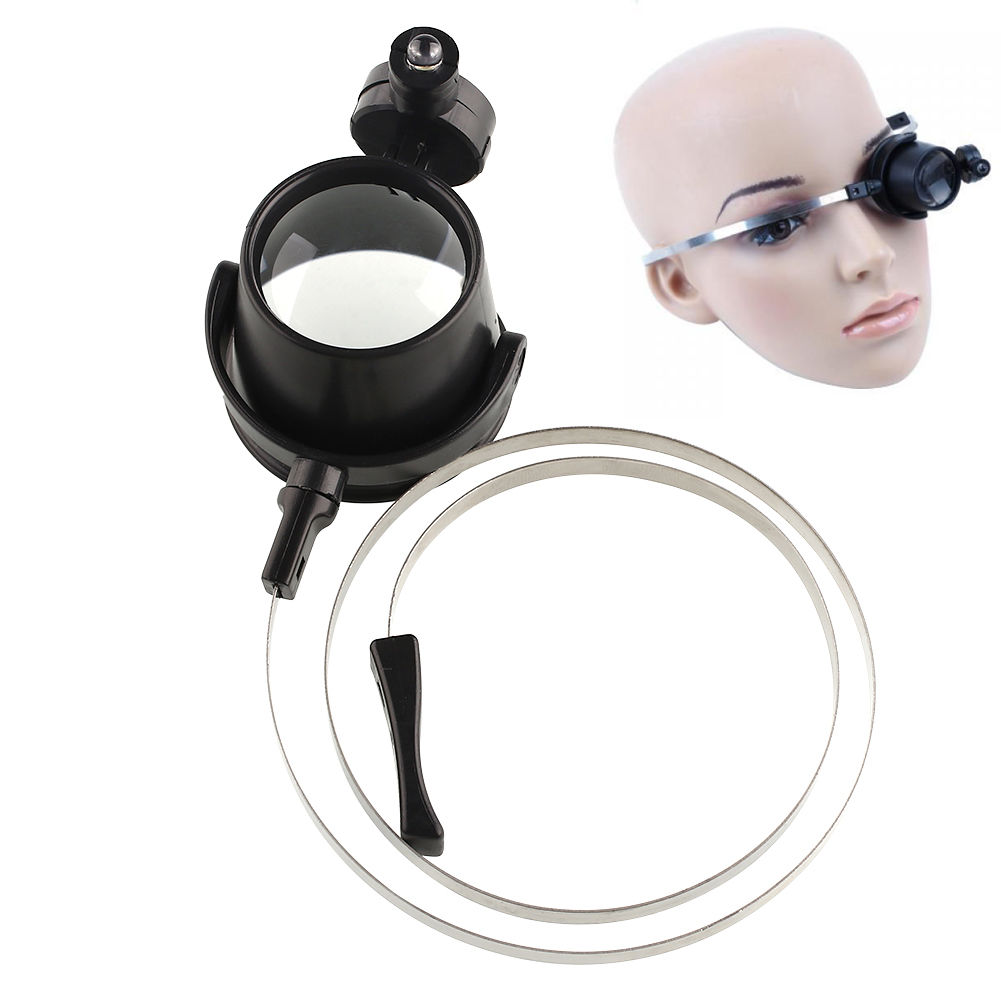
I’ve got a little more hair than the dummy in the photo, and the sprung steel band is inclined to grab your hair/beard/collar or fly off and land in your coffee. ![]()
They are good for inspection and very close up work, but the focal distance is too short to solder with, as you risk setting fire to your nasal hair. ![]()
http://www.ebay.co.uk/itm/Eye-Glasses-L … SwQupXUTSp
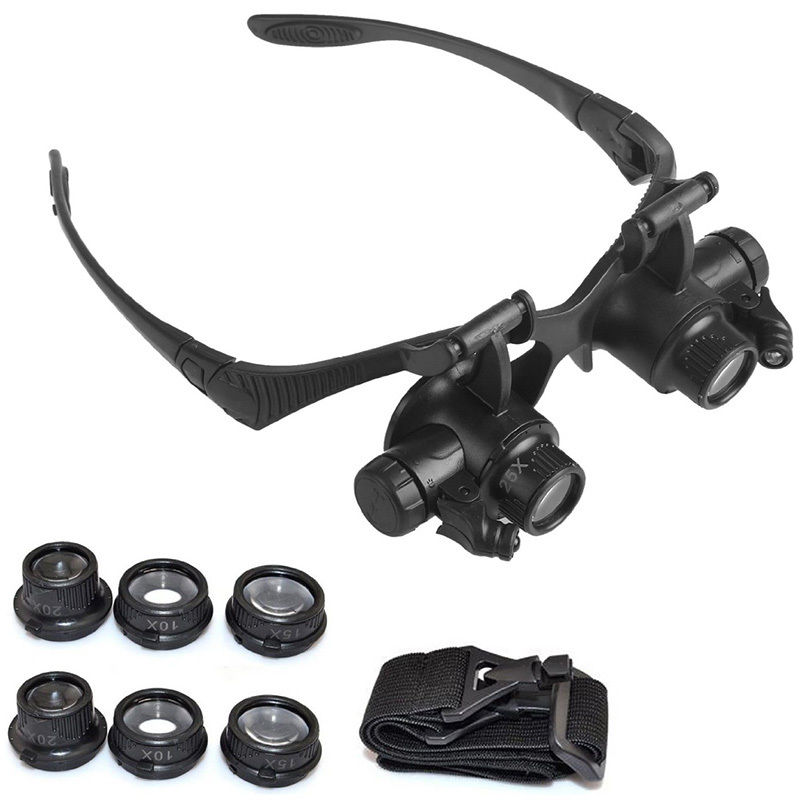
But they are useless, the lens diameter is too small.
The frequency graph (in ppm or 1/1000000 units) is below. You can see it stayed within a 0.770 ppm range, which is acceptable for my TCXO, which has a spec of +/- 2.5ppm.
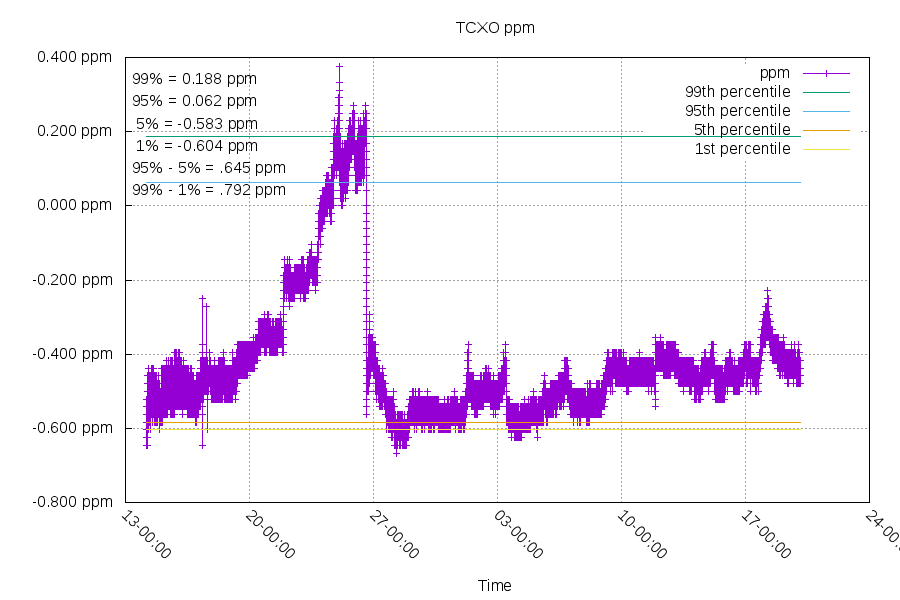
I also created a video of how the frequency changed over time and its relationship to temperature. Each frame is 2 hours of data. The X’s and +’s are the individual cycle counts compared to the room temperature. You can see there’s not much frequency change with temperature change, it’s mostly horizontal movement. There is however an slow drift upwards (maybe it’s aging? The spec for aging for this TCXO is 1ppm/year). There’s also a jump down at hour 297. I think I want to try this again with a better spec TCXO.
Also this… which relates to a Maxim ADC, but the underlying methods are probably relevant to your use case.
There is also this… which might be of interest.
Also this… which relates to a Maxim ADC, but the underlying methods are probably relevant to your use case.
There is also this… which might be of interest.
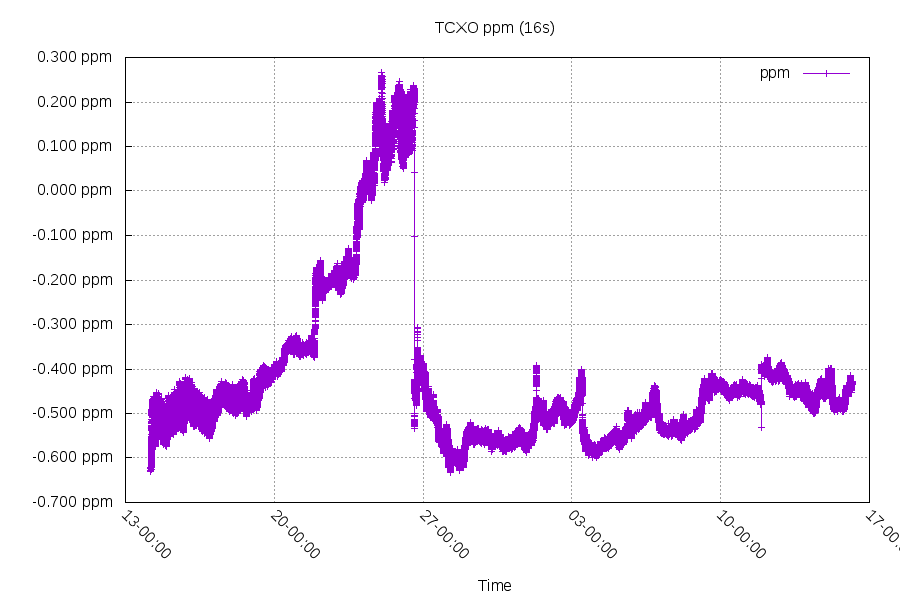
Below is a graph of frequency error averaged over every 16 second interval
And the next graph is an Allan deviation comparison. Allan deviation measures frequency stability over various time periods. The clock all these sources are being compared against is the GPS system (which is more accurate than I can currently measure).
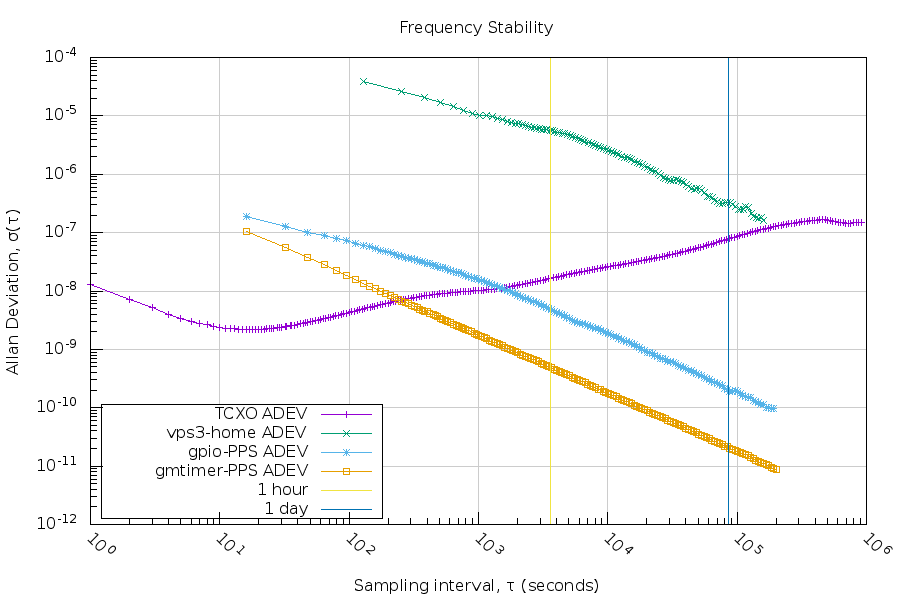
The Y axis is frequency stability, and the X axis is the time period length. Smaller numbers (down) on the Y axis are better. For reference, 1ppm = 10^-6. There’s four different clocks being compared.
Purple “TCXO” clock line – this stm32f030 board
Dark Yellow “gmtimer-PPS” clock line – a Beaglebone Black with a hardware timer driver connected to a local GPS module
Light Blue “gpio-PPS” clock line – a Beaglebone Black with a gpio interrupt based driver connected to a local GPS module
Green “vps3-home” clock line – NTP (custom client) over the internet
The TCXO isn’t synced to any system, so in long time spans, it drifts off of its proper frequency. Since all the other systems are synced to a GPS (directly or indirectly), they don’t drift off after hours or days.
My goal for this module is to provide frequency stability to machines being synced over the internet. This would be combining two time sources: the green “vps3-home” line, and the purple “TCXO” line. At the “1 day” marker, the network source moves around by +/-0.320ppm and the TCXO source moves around by +/-0.08ppm.
You can see that in detail in this next graph, where each frequency sample is an average over 1 day.
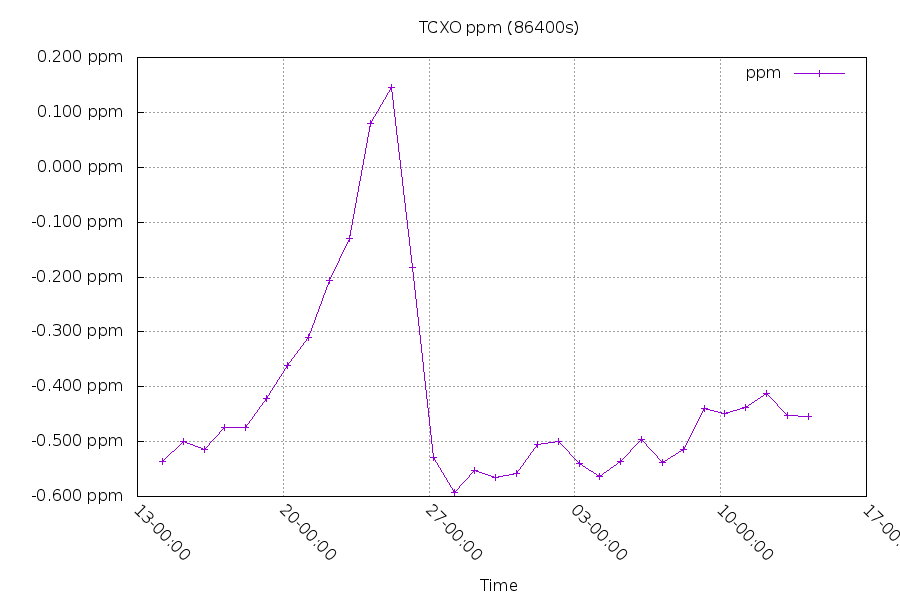
From that graph, you can see that one day to the next, it mostly moves less than 0.08ppm.
My next step is to feed this better frequency stability into a Raspberry Pi or other SBC. I’ll be using the gpio interrupt driver for that, and the limits on that driver’s accuracy and precision are given by the blue “gpio-PPS” line. I’ll need to combine the local frequency stability over the short term with the long term frequency stability from the network. I have some ideas for this, but I haven’t written the code yet.
I’m pretty happy with this result. My GPS module is only accurate to 1e-8 at 1 second anyways, and my measurement precision limitation at 1 second is 2.1e-8. At around 10 seconds, my measurement precision limitation is 2.1e-9. So the TCXO is pretty much right at my measurement limit for very short timescales. I wasn’t expecting that at all.
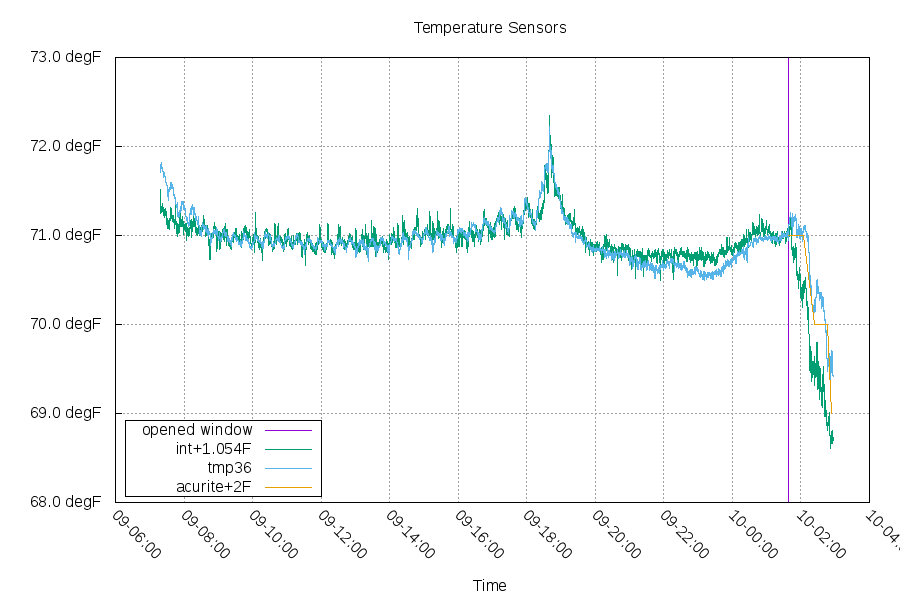
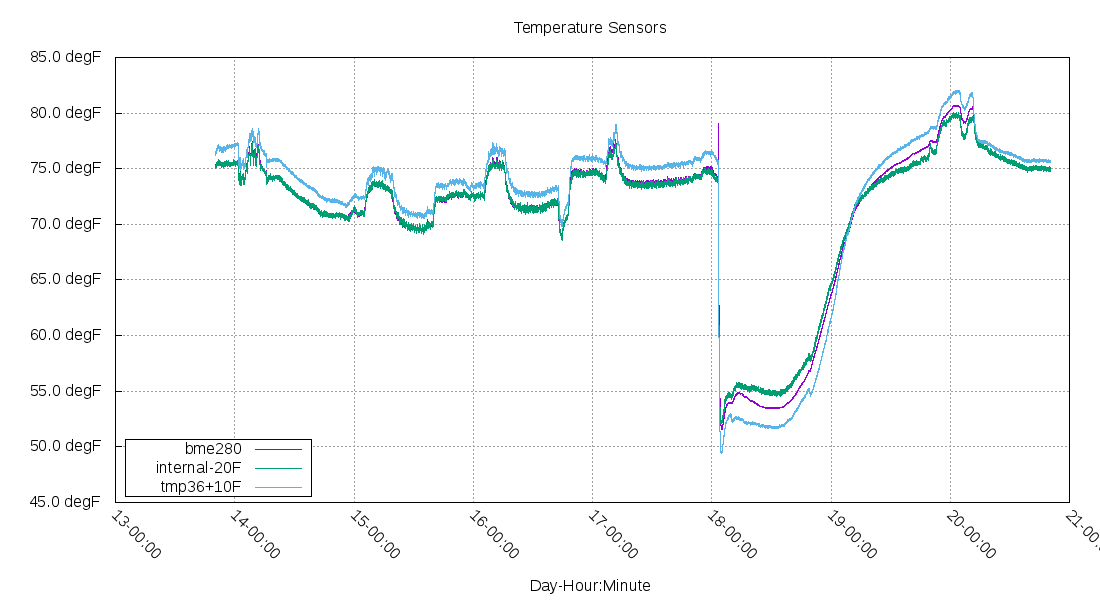
Blue is the TMP36 and Green is the internal temperature sensor. The internal temperature sensor is shifted up by 1.054F to make the relative movements easier to see.
After letting it run overnight, I opened a window and started recording temperature values by hand from a third sensor – a “Acu-Rite weather station”. Those values have been shifted up by 2F. The temperature outside is around 6F colder than the room, so you can see all the sensors falling in response.
I suspect the difference in relative temperature changes between the stm32f103 internal sensor vs the TMP36 come from the packaging. The stm32f103 LQFP48 package has a 55 C/W theta JA spec, while the TMP36 TO-92’s datasheet has 162 C/W theta JA. So temperature changes should cool down/heat up the stm32f103 package quicker.
My next tests along these lines is to setup a BME280 and add its data.
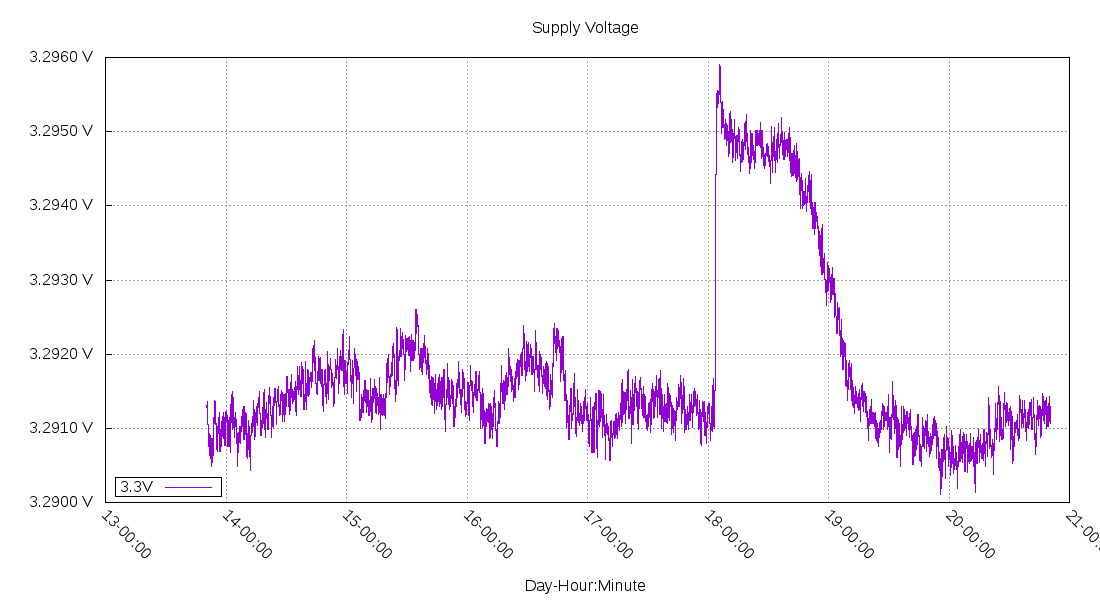
The Vref data measuring the stm32’s supply voltage looks like this:
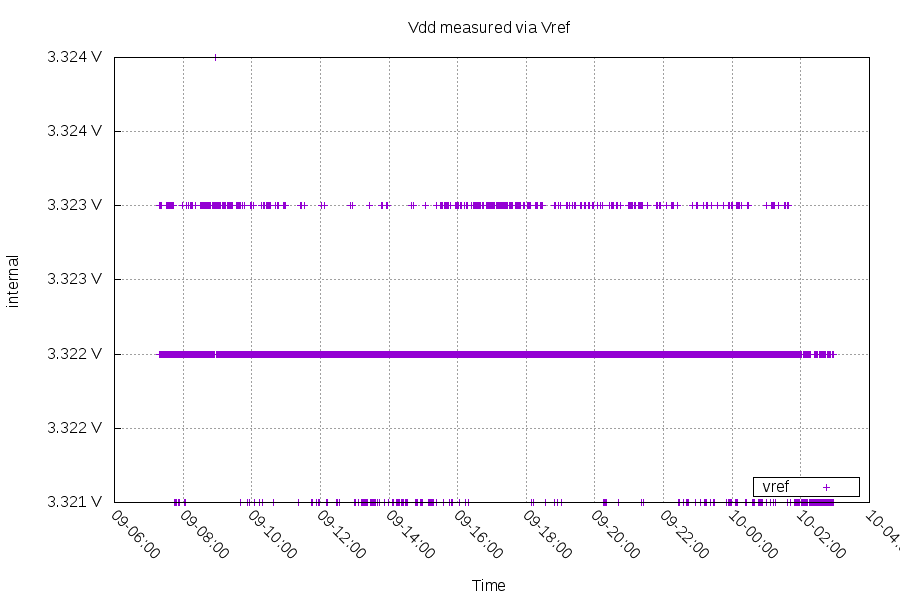
I’ve set the expected Vref voltage to 1.206 V (datasheet Vref: min 1.16V / typ 1.20V / max 1.24V) after calibrating it with the Vdd measured by my multimeter (3.321V). I haven’t experimented with varying the Vdd, but that could be interesting too.
The full vref axis on that graph is 1.8mV, which is just over 2 LSB (+1 [email protected] = 0.8mV) of the ADC! That’s probably where most of the artifacts come from. But I do seem to be getting valid data within +/- 200uV, which is pretty cool.
I also assume both my voltage supply and the internal bandgap voltage reference are moving, just not at the same speed. I think this works out to be roughly 300ppm/degC. I think this voltage regulator is specified to be +/-0.5% (5000ppm) over its full temperature range, but it’s not a linear relationship.
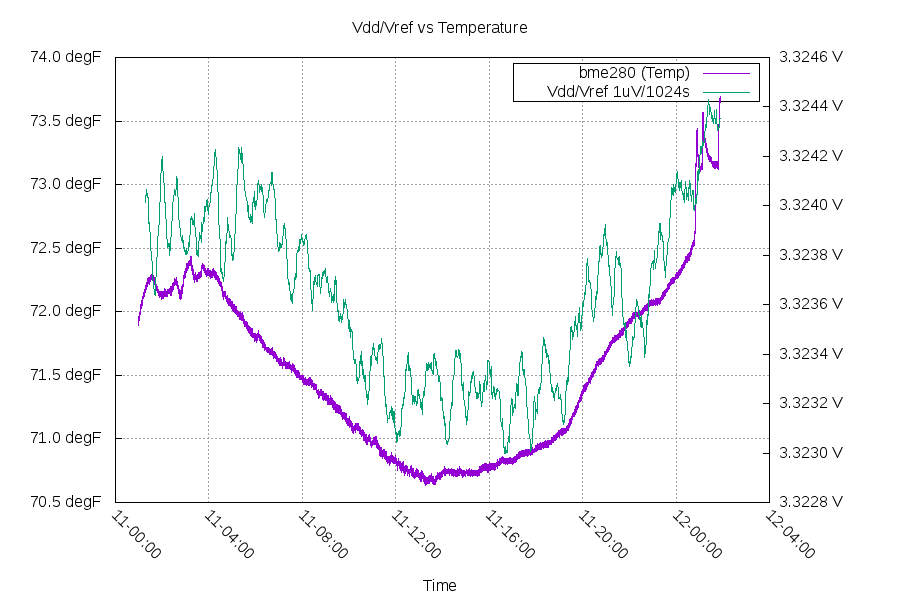
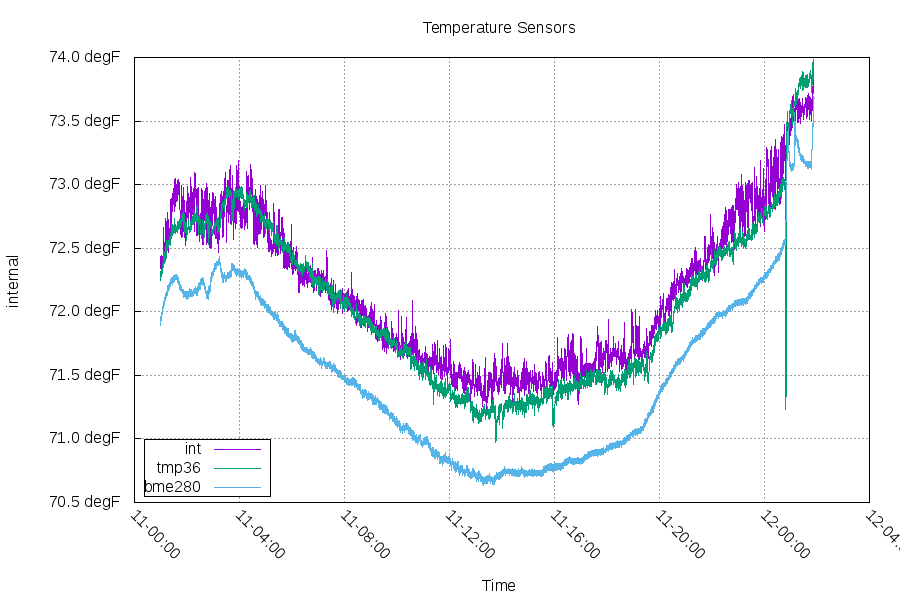
The bme280 sensor gives really nice data, and I’m not even using its oversampling or filtering modes.
Temperature compared between the three sensors (all on the same breadboard):
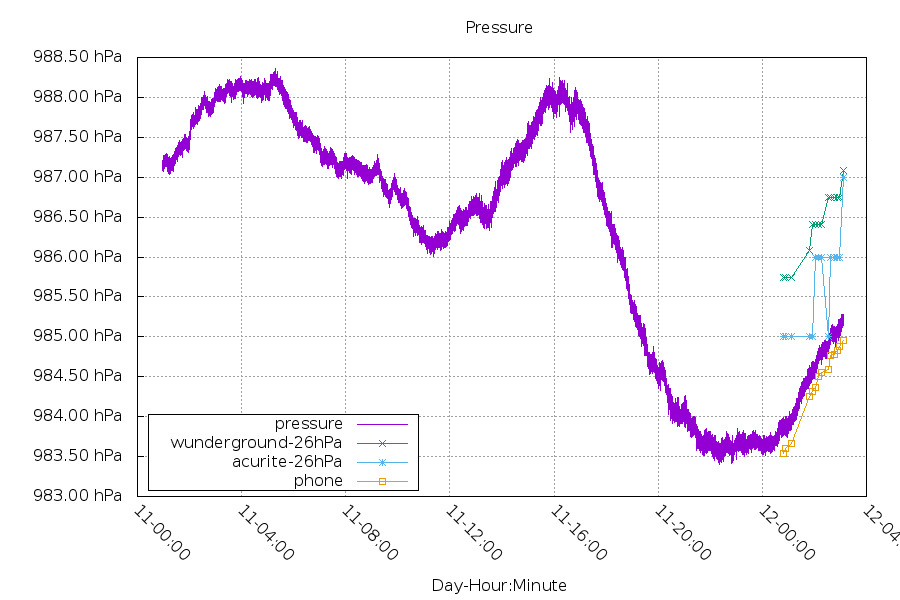
Pressure data matches well against my phone (which seems to have a BMP280). My weather station and the wunderground website disagree with the bme280 by almost 30hPa, which is odd. But they all track relative changes pretty well.
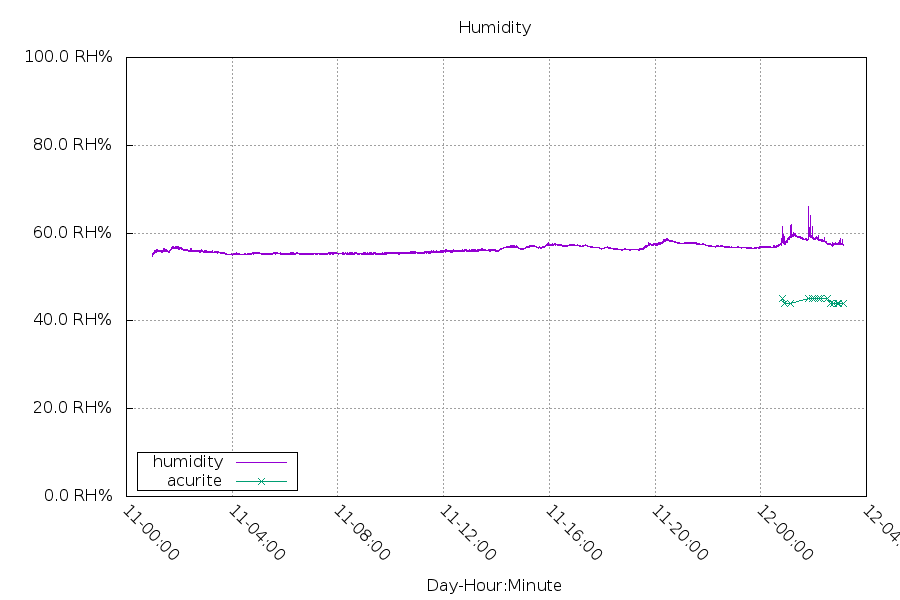
Lastly the humidity data. I don’t care about it, but I’m collecting it anyway. So here’s a graph!
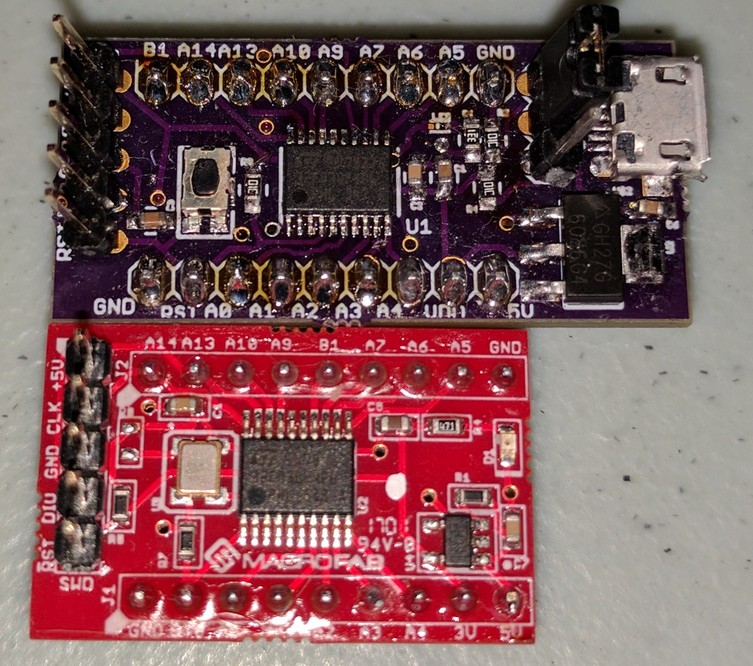
top: old version, bottom: new version
I used them to measure the accuracy of two “TCXO” RTCs: the DS3231 and the PCF2129: https://blog.dan.drown.org/rtc-comparison/
I really like these graphs of the PCF2129’s frequency vs temperature:

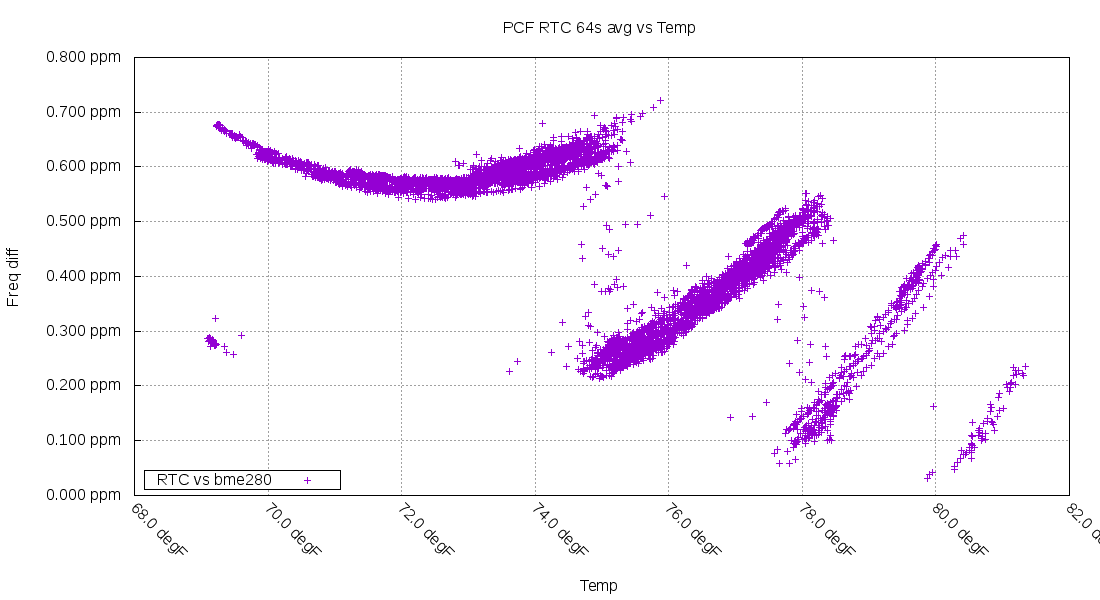
They’re from two different runs, and you can see it switching in different amounts of load capacitance based on the temperature. In this way, it can keep its internal frequency to a smaller range (and have more accurate time in the long term vs not adjusting for temperature).
BTW.
Whats also interesting is that you used MacroFab to phsically make the board
There demo seemed to make this cost effective for SMD prototypes (as I’m not very good at SMD and never managed to get my oven to work correctly ;-( )
BTW.
Whats also interesting is that you used MacroFab to phsically make the board
There demo seemed to make this cost effective for SMD prototypes (as I’m not very good at SMD and never managed to get my oven to work correctly ;-( )
It can take 2 to 3 weeks just to get PCB’s, so a month for the whole lot isn’t that bad
But some highlights:
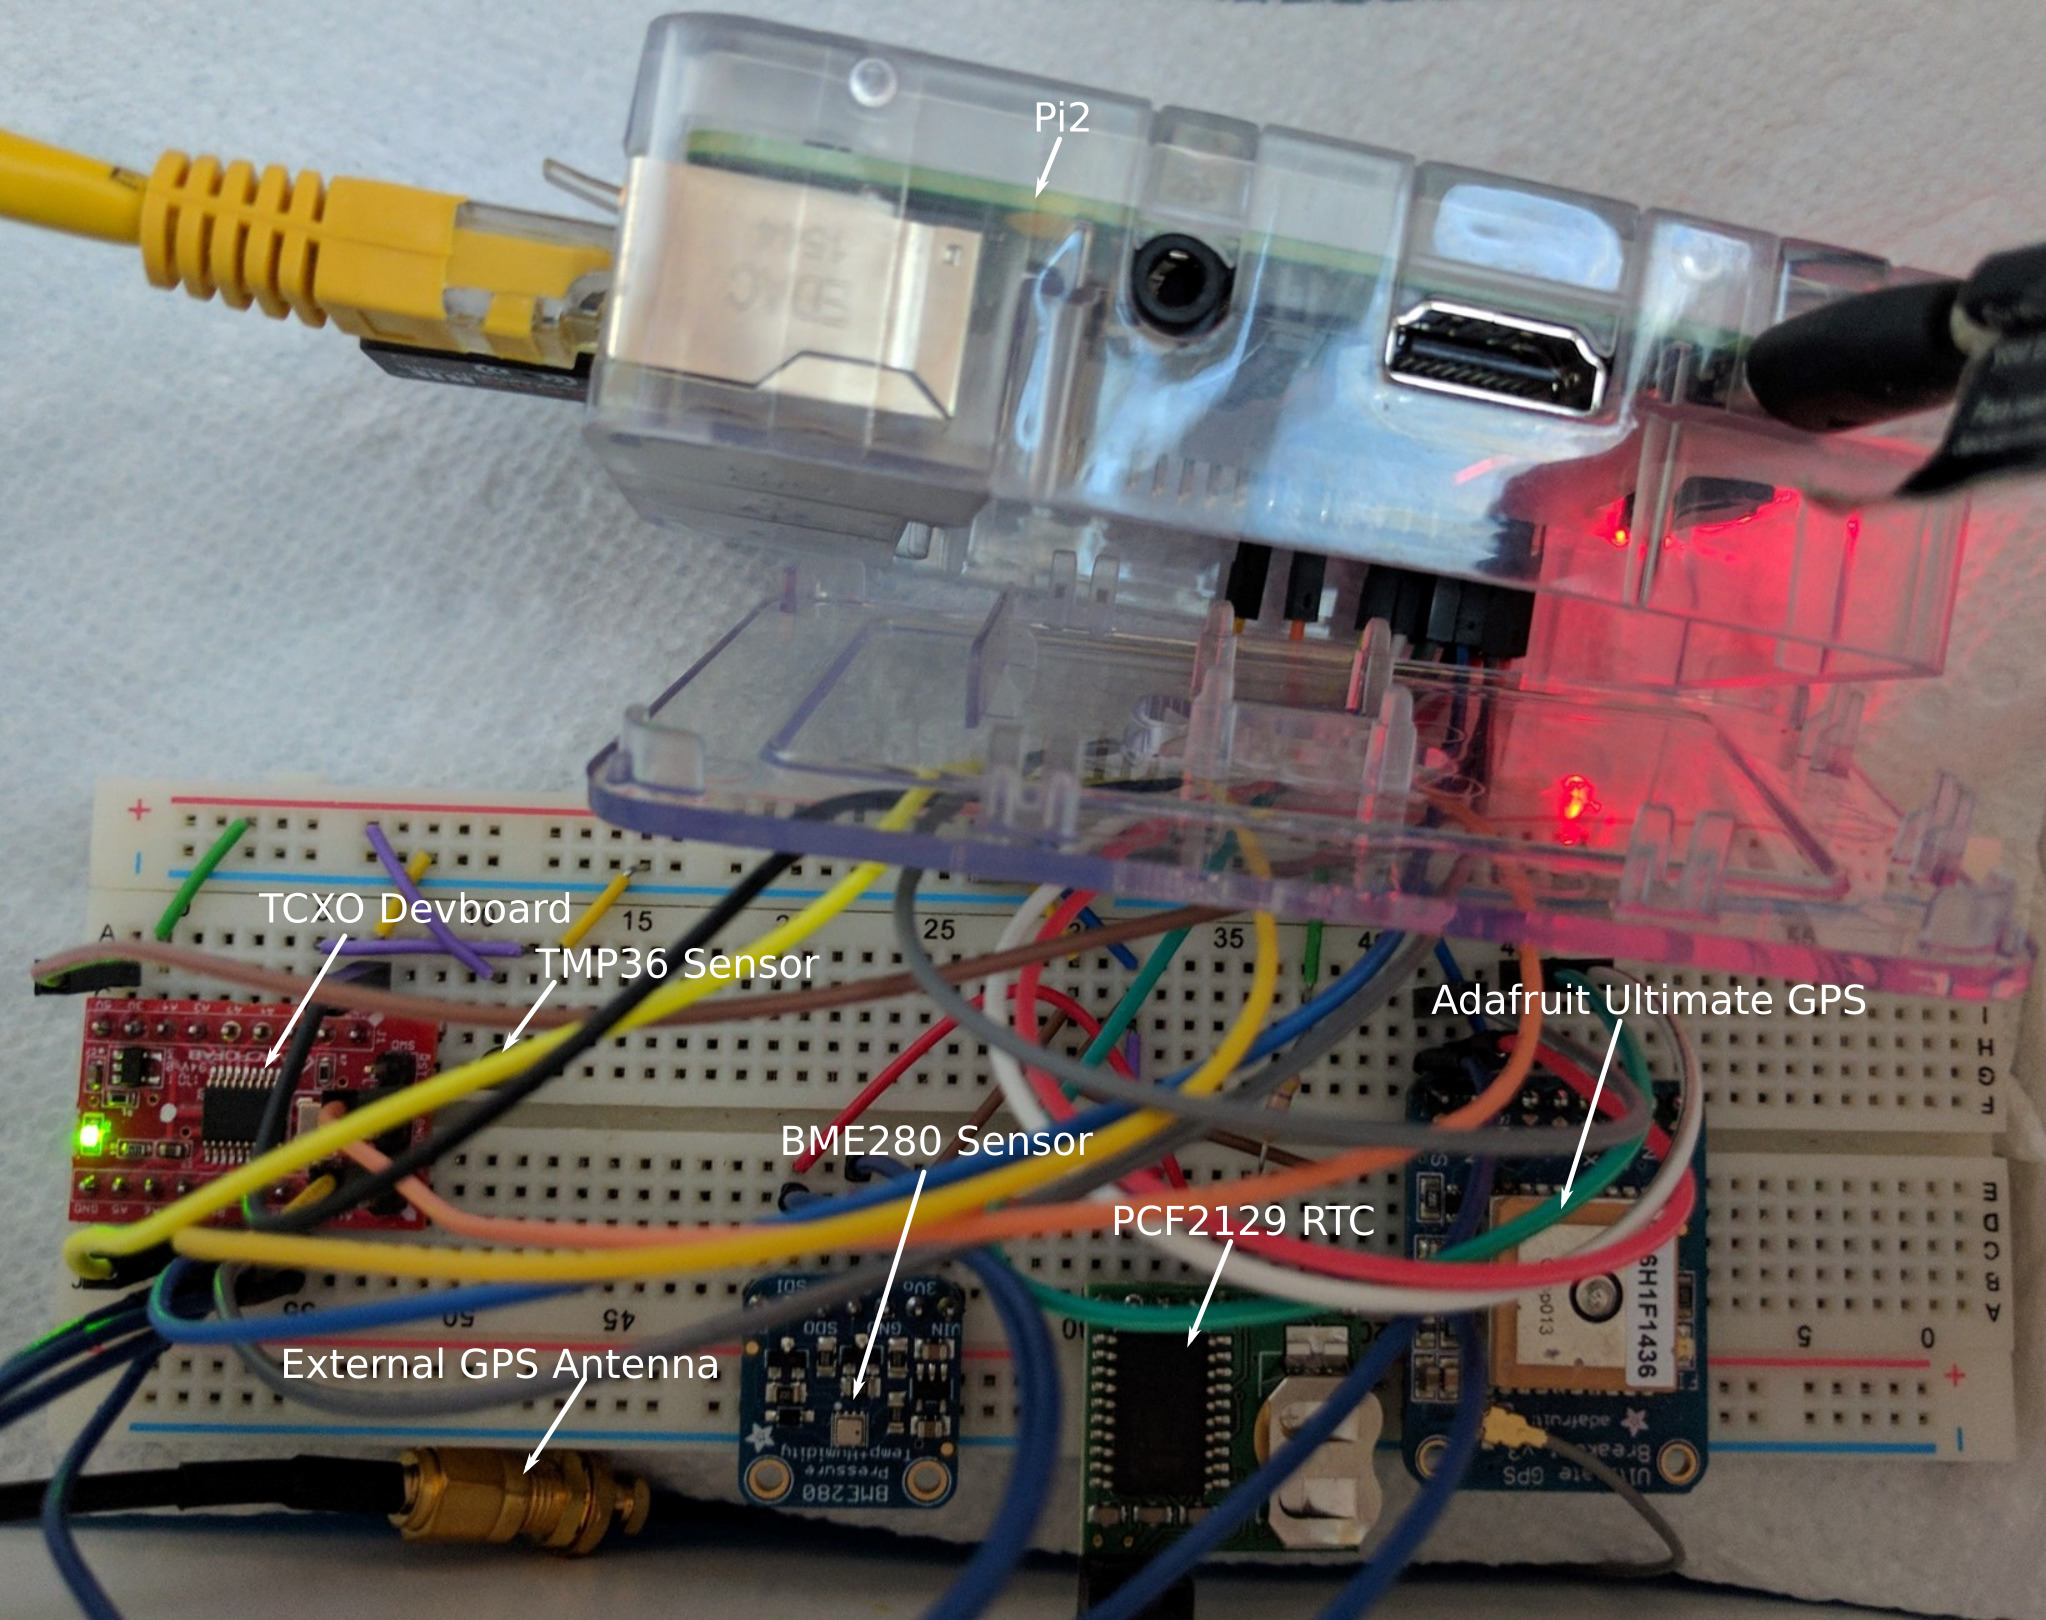
Test system:
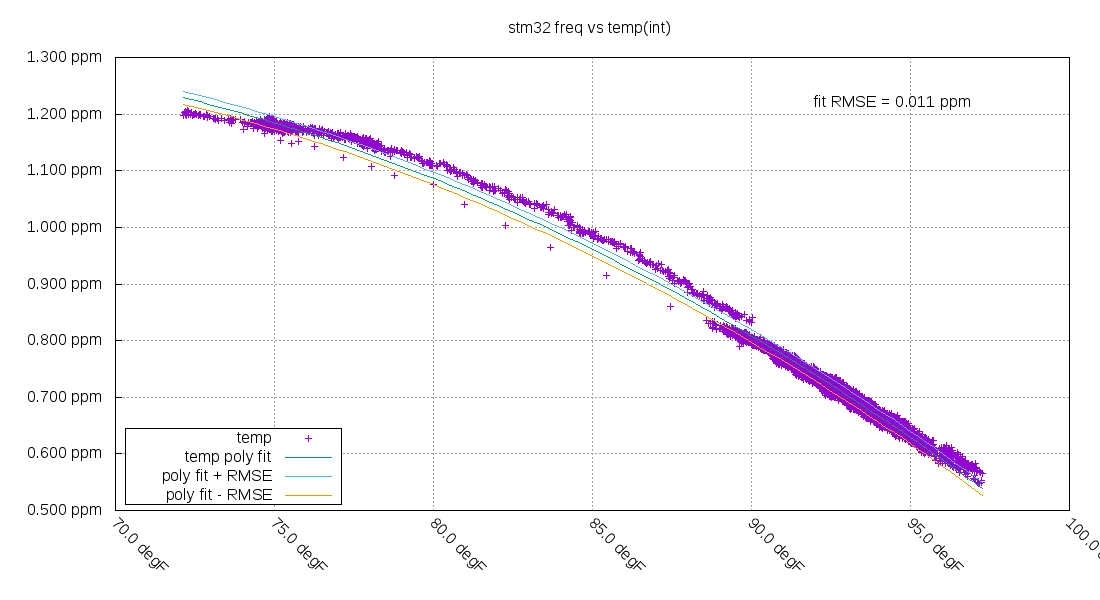
Frequency vs temperature:
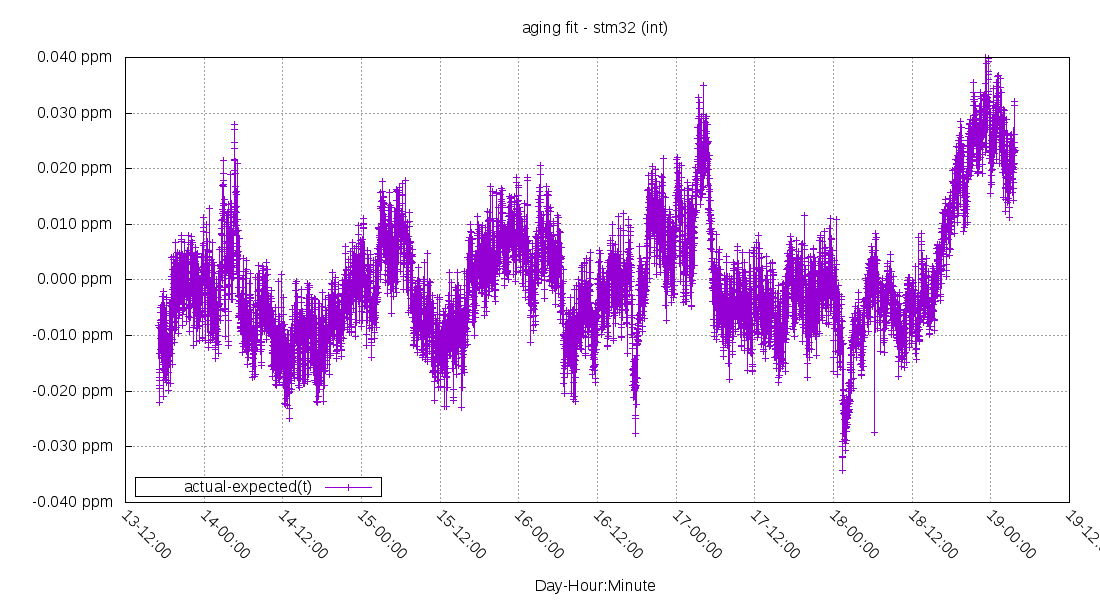
Remaining error after removing the fit line from the previous graph:
When the temperature goes down:
My supply voltage goes up by 4mV:
http://www.ebay.com/itm/NEW-10MHz-OCXO- … 2308905189
DS
http://www.microcrystal.com/images/_PDF … r/OCXO.pdf
Uses less than 80ma@20c , 300ma@startup (10 sec) , they’re 5v supplied
This one seems to have somewhat same specs
http://www.ebay.com/itm/10MHz-OCXO-DIP- … 2868381695
http://www.golledge.com/pdf/products/ocxos/scocxovt.pdf
/Bingo
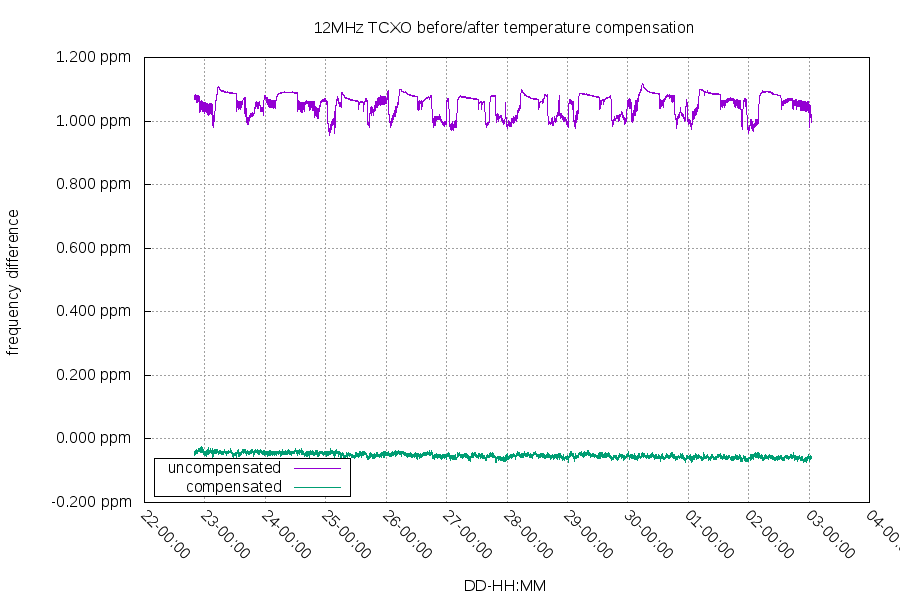
First, an image of the TCXO’s raw frequency vs the temperature compensated frequency. You can see the compensated frequency is much less noisy and much closer to 0ppm.
Zooming in to just the temperature compensated frequency:
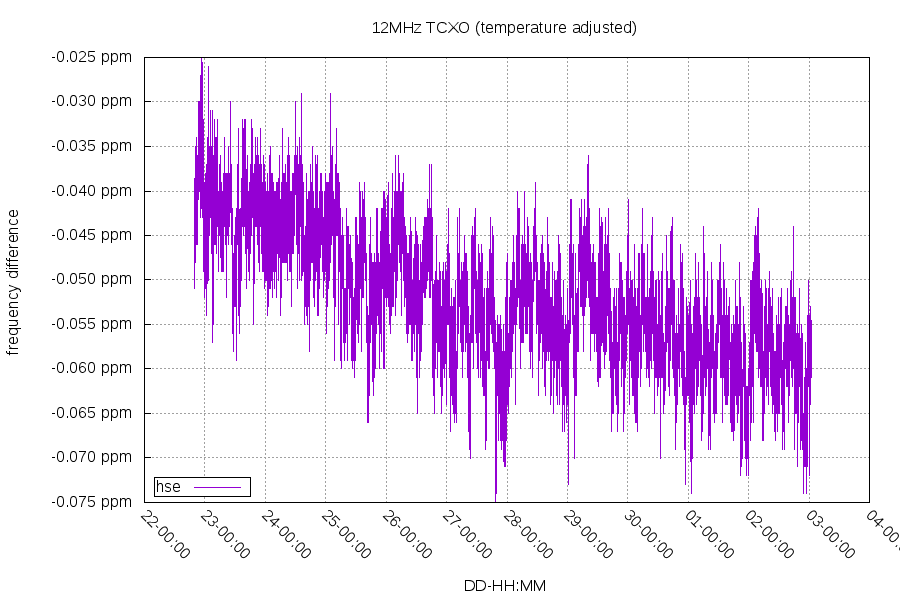
99.9% of all samples were between -0.030ppm and -0.072ppm, a 0.042ppm range. This range is my clock’s uncertainty. The situation is slightly better than that, as 24 hour periods have a smaller range. You can see the aging is around 0.015ppm/week (1ppm/year is roughly 0.019ppm/week).
The new boards also have a LSE, but it’s just a regular crystal. I’m using TIM14 to compare the LSE frequency to the TCXO.
Some notes about measuring the LSE:
- To lower the interrupt rate, I used the MCO to get LSE/128, and then TIM14’s input capture divides that by /8 to get a final interrupt rate of 32Hz.
- TIM14 is a 16 bit timer, and TIM2 is a 32 bit timer. I used both to measure the exact difference in length of 1 second between the LSE and HSE.
- The RTC’s frequency adjustment is in steps of 0.954ppm units. So I used dithering to average out the error. I set a new RTC adjustment every 30 seconds
- I configured the RTC to have 1/1024 second units (slightly better than 1 millisecond)
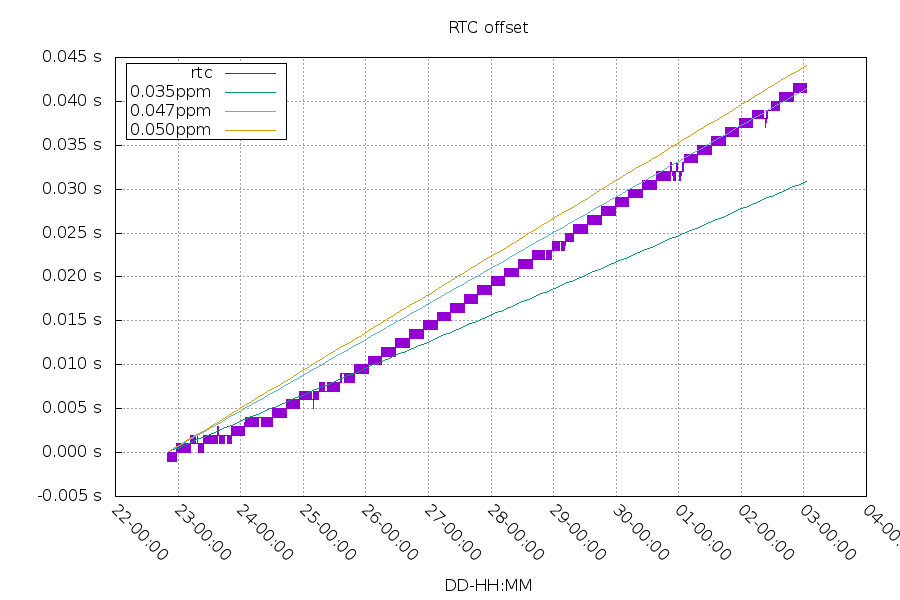
The green is the difference in frequency between the LSE and HSE. I compared against the temperature compensated frequency from the HSE. The purple is the RTC frequency adjustment value used.
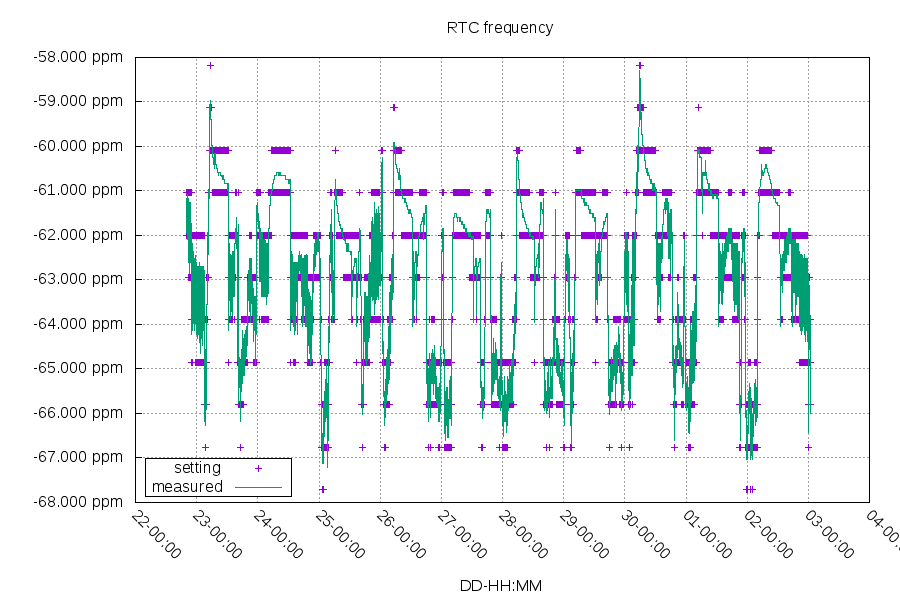
The RTC clock was set to a 0 second offset at the start and left to run only on frequency control. The offset of the RTC clock was compared to the GPS module’s PPS. The blocky nature of the purple line comes from the 1/1024 second unit limitation. I’ve included three frequency error lines to show the ranges of frequency error.
Bonus pictures:
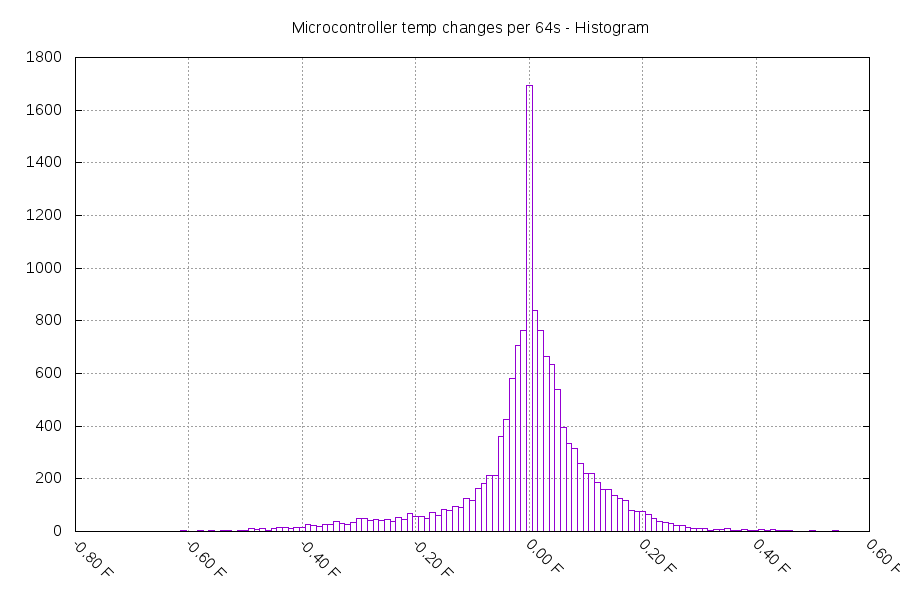
Temperature change between every 64 second reporting period.
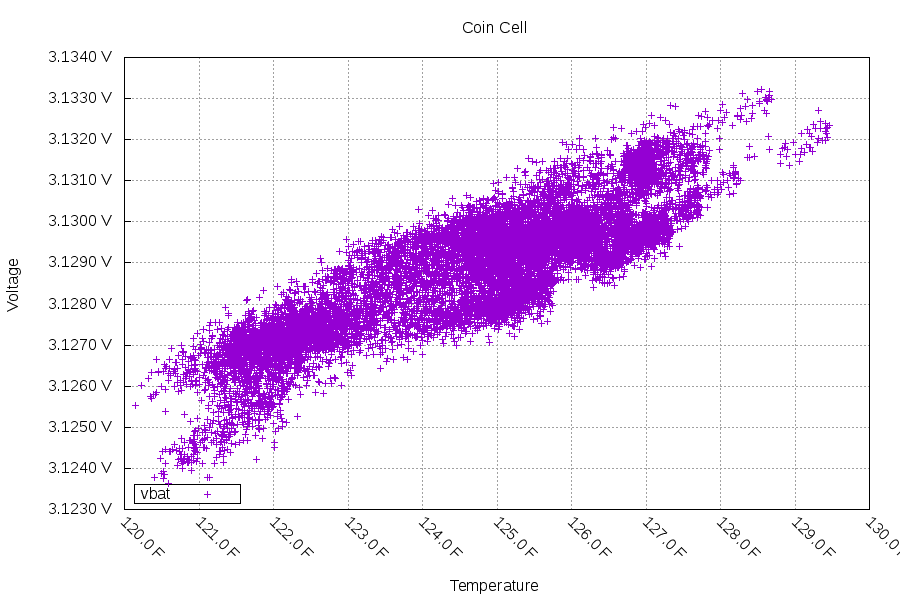
Coin cell battery verses temperature (adjusted for changes in supply voltage).